
Introduction
RCH Care Homes is a caring family-owned business, underpinned by a leading team of skilled and experienced care experts. Our Senior Team consists of family members and carefully selected care sector specialists, who provide expert direction and guidance to our regional and care home teams. Together, we endeavour to create warm and welcoming care homes where residents receive the kind of high-quality and personalised care that would be fit for our own precious family members.
Since our creation in 1991 as a medium-sized and established provider, we believe relationships are fundamental to our ongoing success. We take pride in getting to know the residents, their loved ones and team members. Through these bonds, and by working together as a team, we are able to deliver kind and compassionate care for the extraordinary people living in our homes.
Alongside this, we provide help to the most important people in their lives and support the dedicated care home teams to be the very best people and teammates they can be.
Simply living life comfortably in one of our homes isn’t good enough for us. We strive to ensure all residents spend their days enjoying the things that they love, feeling happy and contented, and receiving expert care that not only meets their physical and mental well-being needs but also supports them to live their lives to the full.
How are the Median Gaps Calculated?
Using the calculations set out in the gender pay gap reporting regulations, we have taken pay data for relevant roles from the entire business which includes many different roles that bring a variety of rates of pay.
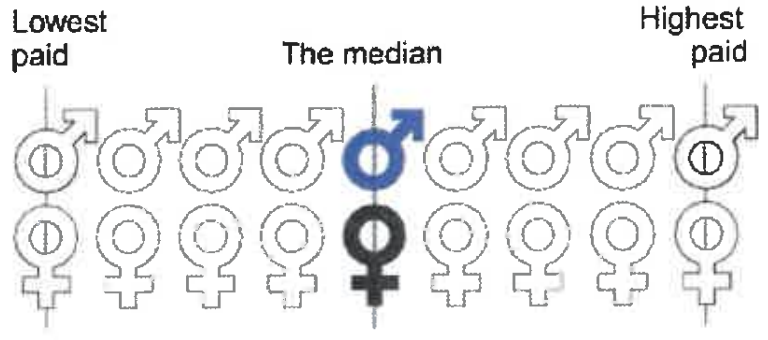
Imagine if all employees stood in two lines (male and female) in order of lowest hourly rate of pay to highest. The median gender pay gap is the difference in pay between the female employee in the middle of their line and the male employee in the middle of their line.
How are the Mean Gaps Calculated?
The mean gender pay gap shows the difference in average hourly rate of pay between men and women. This is also affected by the different numbers of men and women in different roles.
Bonus Payment Calculations
Bonus pay includes any additional pay relating to profit sharing, productivity or performance, when in the form of money or vouchers.
Both median and mean calculations are carried out when comparing bonus pay over a twelve month period. The proportion of men and women awarded any bonus pay over that period is also reported.
How are the Pay Quartiles Calculated?
As part of the gender pay report, we also show the percentage of men and women in each pay quartile.
Quartiles are calculated by listing the rates of pay for each employee across the business from lowest to highest, before splitting the list into four equal-sized groups and calculating the percentage of males and females in each.
What’s Included in our Hourly Pay Calculations?
Calculations of mean and median pay and of quartile pay bands are based on data from April 2023, including ordinary full pay and bonus/commission paid in the same pay period.
Ordinary pay is not limited to basic pay, but also includes other types of pay such as pay for leave and shift premium pay. It doesn’t include pay for overtime, pay relating to redundancy/ termination of employment, pay in lieu of leave or the value of benefits which are not in the form of money.
Results
Summary
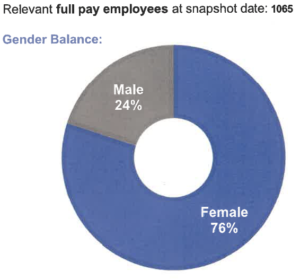
- The hourly pay calculations in this report are based on 1065 relevant full pay employees
- Bonus pay calculations are based on 1065 employees
- The mean hourly full pay gap is -2.73%; in favour of the female workforce and the median hourly full pay gap is 0.14%, both in favour of the male workforce.
- The mean bonus pay gap is 48.18%; in favour of the female workforce. The median bonus pay gap is -50.00%, in favour of the female workforce.
- 15.95% of all relevant males and 18.32% of all relevant females received a bonus payment in the twelve month preceding the snapshot date.
Pay – Hourly Rate
The difference between men and women.
| Mean | Median | |
| All | £12.26 | £10.05 |
| Female | £12.34 | £10.05 |
| Male | £12.01 | £10.07 |
| Pay Gap | -2.73% | 0.14% |
Pay Quartiles
Total distribution of male and female employees by hourly pay quartile
| Lower | Low-Mid | Upper-Mid | Upper | |
| Female | 81% | 72% | 76% | 74% |
| Male | 19% | 28% | 24% | 36% |